The reason for your changes in the number of visitors may be related to the awareness of your brand. Brand searches are essential for direct and organic traffic. Although tracking only non-brand traffic seems right to measure SEO success, I also recommend monitoring the brand traffic. Google Trends is a free Google tool that measures interest in your brand. We can also compare our trend with the competitors.
Brand searches also indirectly affect non-brand traffic. I have previously written my thoughts and reviews on this topic for SimilarWeb. You can read How Brand Reputation and Mention Impact SEO link.
For these reasons, adding Google Trends data to SEO reports can make your job easier. It will be a waste of time to take and send a screenshot from the Google Trends interface every month or manually add it to your dynamic Data Studio report. So we’ll look at how we can directly embed data into Data Studio.
The Gtrends.app that I mentioned in the post is a free service created by StrategiQ.
Contents
Step 1 – Generate an API Key
First, we need to generate an API Key for Gtrends.APP. We will be able to pull the Google Trends data we get into real-time Data Studio with that.
To get the API key, follow this link and write your e-mail address under the heading “Step 1: Register for an API Key”.
After a few seconds, a specially created API key for you will be sent to your e-mail address. It would be best if you only used this key for your own reports. This is how API creators track overuse and requests.
Step 2 – Add the Connector
Now we need to add a new Connector to an existing or newly created Data Studio dashboard.
You can access the sample report I created by clicking the link below.
Let’s continue. Create a data source by clicking this link. We have to add one data source per keyword and region.
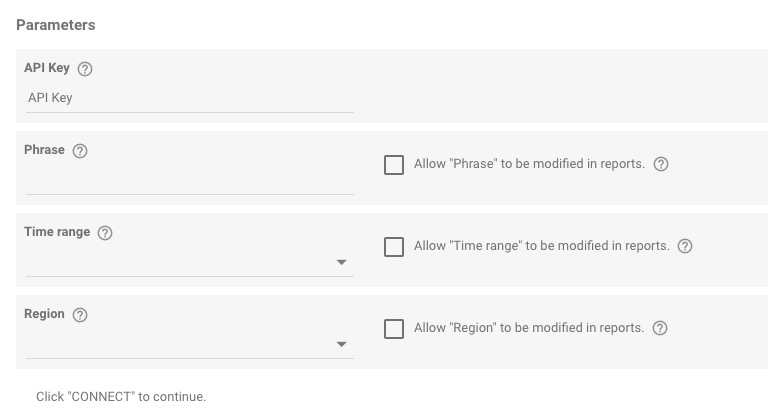
Provide your API Key, Phrase (your keyword), Time Range, and Region under Parameters.
- “Phrase” is a keyword you want to track in Google Trends.
- You can choose Past 30 days, Past 90 days, or Past 5 years in the “Time range.”
- “Region” is the part where you determine in which country you follow your keyword.
Hit to Connect button at the top of the right and create your Time Series.
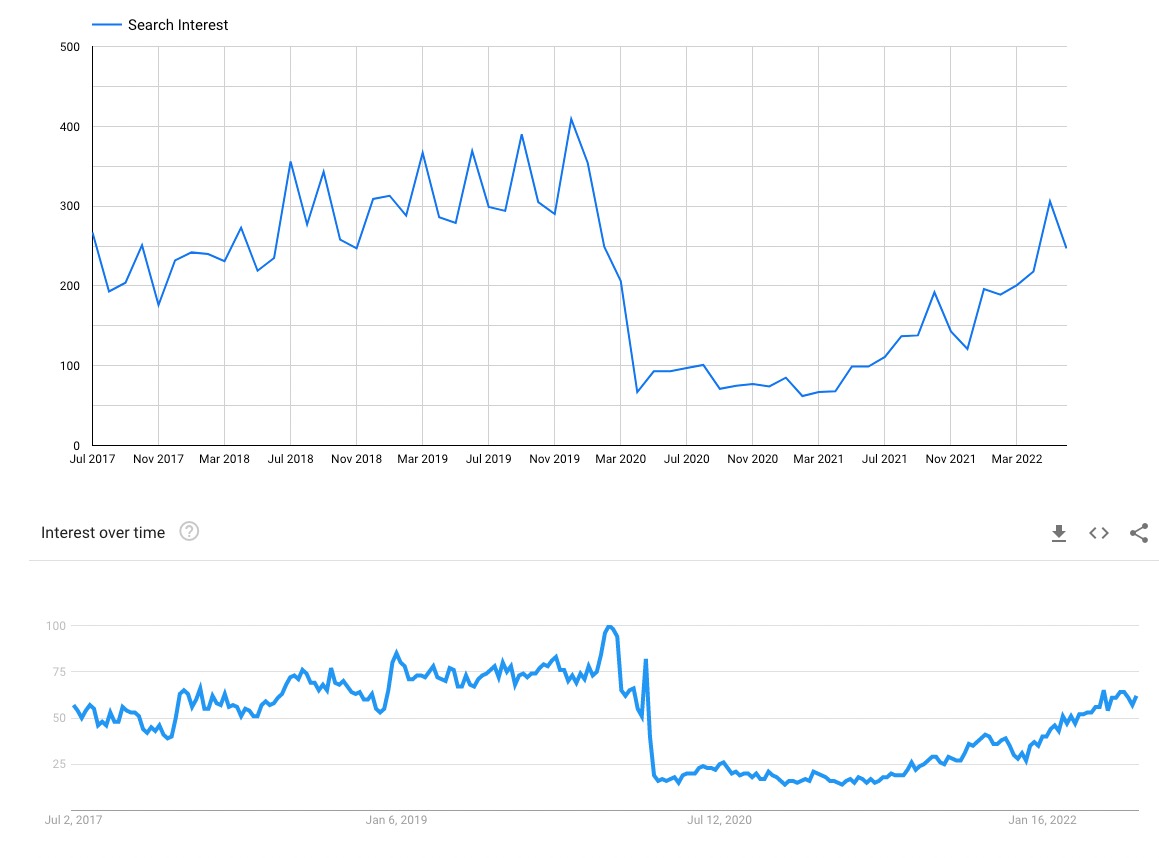
I wrote “paris flights” into the Phrase section. Then I compared my Time Series with Google Trends, and there seemed to be nothing wrong with the data.
Step 3 – Customize Your Time Series
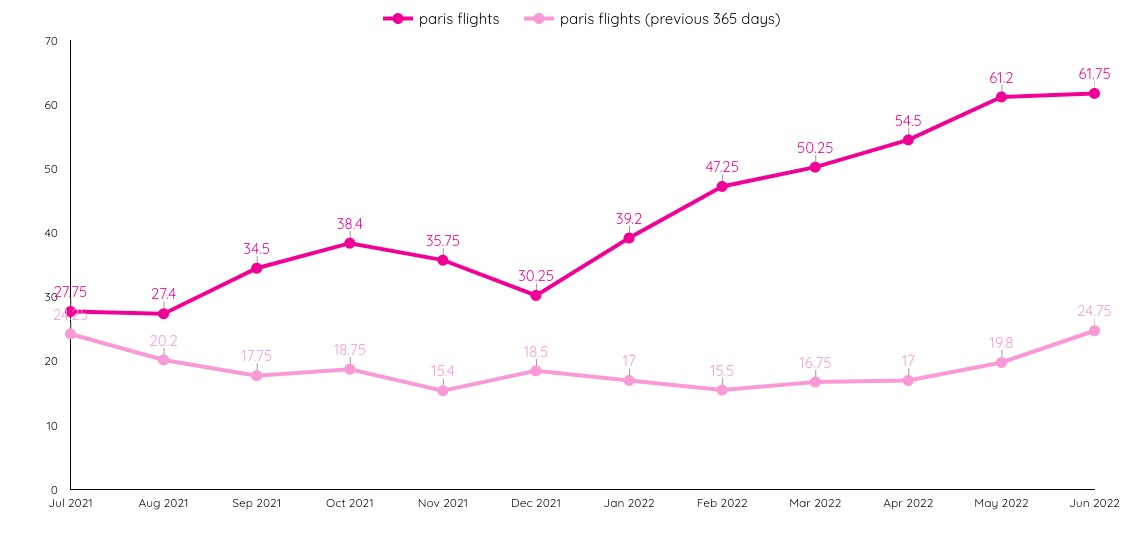
Let’s make our Data Studio report a little more meaningful. I prefer to show my customers the Google Trends report for the last year. That’s why I wrote the last 12 months by choosing Custom > Advanced from the Date Range section. Since I want to compare the data with the previous year, I choose “Previous Period” in Comparison Date Range.
To show my data monthly, I added the Date dimension to the Date Range Dimension and selected its type as Year Month. Then I added the Phrase metric to the Breakdown Dimension.
Finally, in the Breakdown Dimension sort section, I selected Search Interest and selected Average (AVG) as Aggregation. After doing all this, I got the following table with some style adjustments.
Multiple Google Trends Keywords Comparison in Data Studio
So far, we have provided Google Trends data for a particular keyword. You may also want to include comparisons of multiple keywords in your report. We need to create two different resources and use Blend Data in this case.
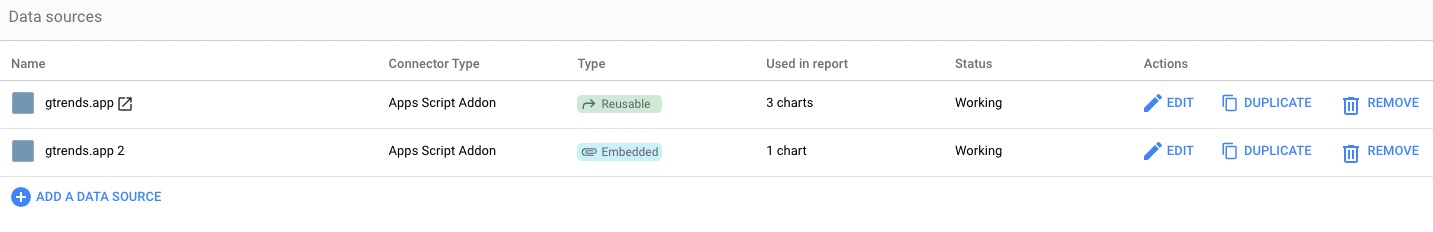
Resource > Manage added data sources > DUPLICATE (near Gtrends.app)
For the copy of the first resource:
- Use the same API key that you used in the first data source.
- Write another keyword that you want to compare with the first one.
- Select the same time period in Time Range that you selected in the first data source.
- Choose the region for your second keyword.
- You can name it gtrends.app 2 or your keyword text for your new resource.
- Hit the Connect button at the top of the right.
We will have a copy of the first resource in our data sources.
Now, let’s create a new chart (Time Series or whatever you want) in Data Studio. Click BLEND DATA under Data source. Then the report will ask us which table we want to blend with our current table.
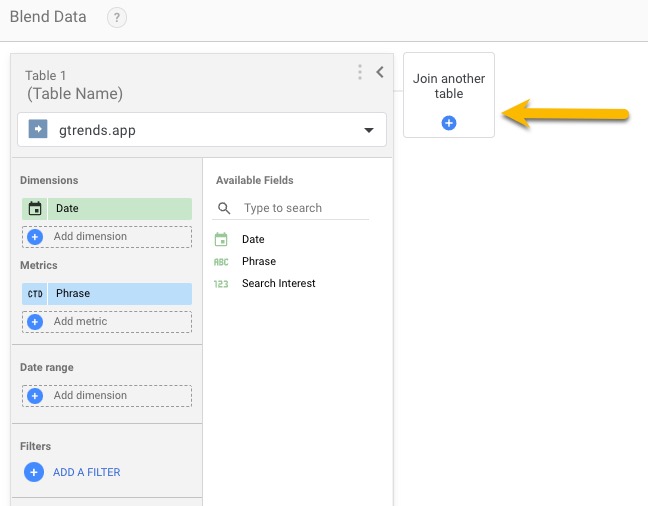
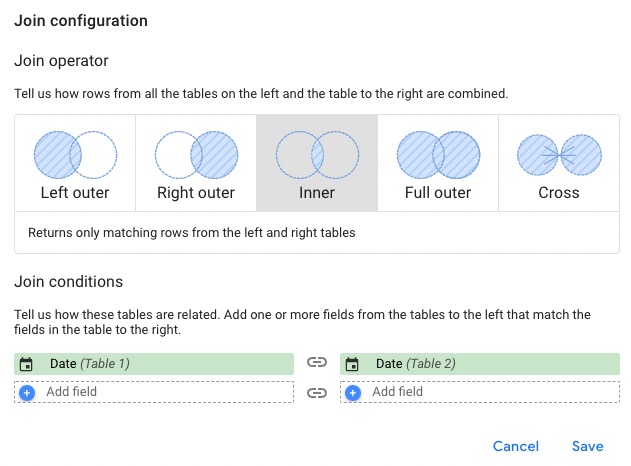
Click on the “Join another table” and choose your new data source created recently. Then, we have to Configure our conditions. Hit to Configure join button between tables.
Here, we have to select Inner because we need to specify that our Date metric is common in our tables.
Our Conditions are done, so let’s set our Dimension and other criteria. Under Dimension, we should select Date and Phrase metrics. Under Metrics, we should select Search Interest resources. The critical point here is to change the names of Search Interests with our keywords. Since my keyword is “paris flights”, I changed the name of Search Interest in my first table to “paris flights”. We should not forget to choose Average (AVG) as Aggregation. Our Blend Data should look like the following screenshot.
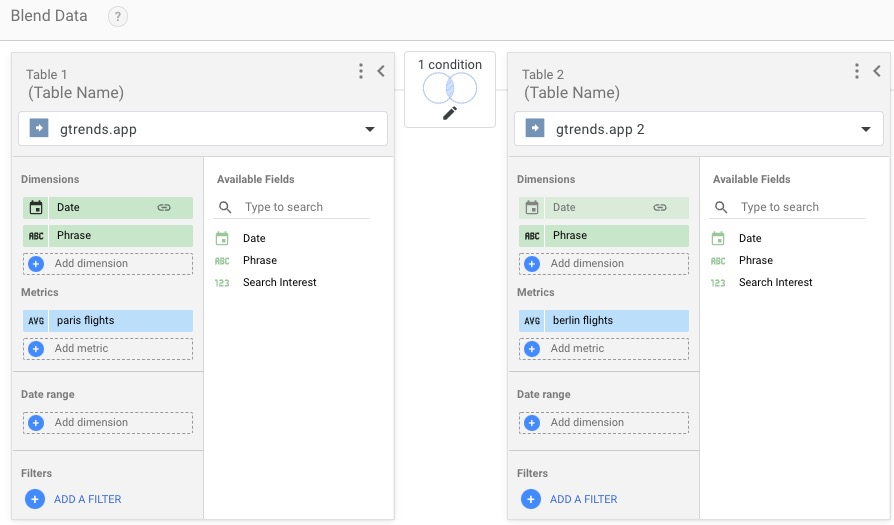
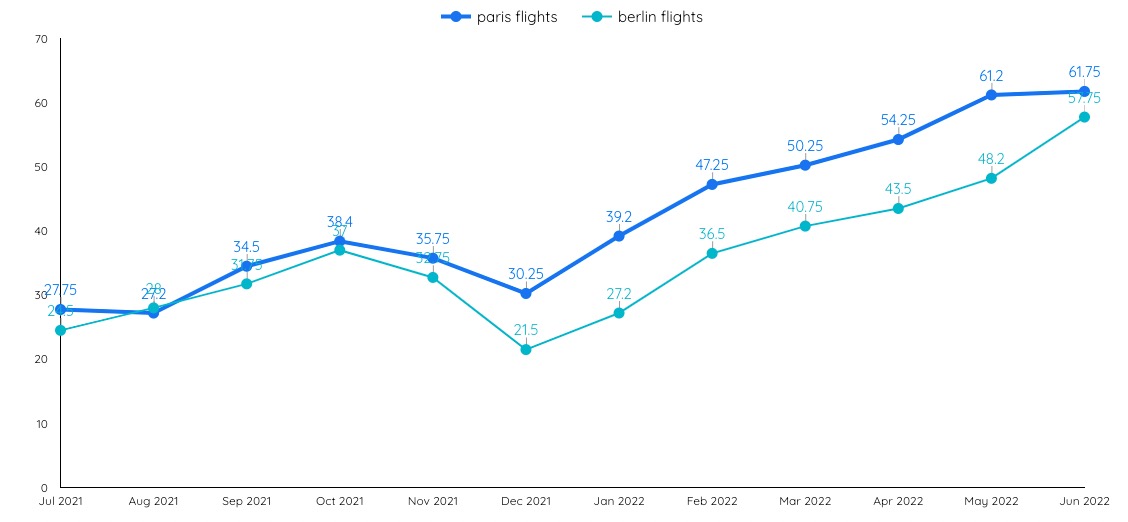
After creating our Blend data, we finally came to the Data Studio settings of our graphic. We choose only Date as Dimension. As Metric, we choose the keyword names that we determined in Blend Data, and again we choose Average (AVG) as Aggregation. That’s all. After making some style adjustments, you will get a graphic similar to the one below.
You can use the Data Studio template I shared above if you want to have the images and settings I created. Btw, do not forget to use your unique API key please.